This article delves into the concept of the standard error of the mean, which quantifies the inherent random error associated with estimating the mean through sampling. Specifically, it explores the correction factor that arises when accounting for the sampling of a finite population.
Continue ReadingIn this post, I will be sharing a curated collection of practical tips and insightful notes that I have used over and over again in my career as a data scientist. These are meant to be personal references for myself but they might help others.
Continue Reading
Mar, 2023
This is a quick guide to make executable shell scripts (.sh) to simplify mundane, repetitive tasks and reduce the amount of time they take.
Continue Reading
May, 2023
This article quickly inspects the most basic queries made on SQL. While SQL queries may appear readable, the proper arrangement of query statements is crucial. Failure to adhere to the correct order can result in query failures or produce unexpected results. In this article, we will explore the fundamental structure of a straightforward yet versatile SQL query, shedding light on its components and their significance.
Continue Reading
June, 2020
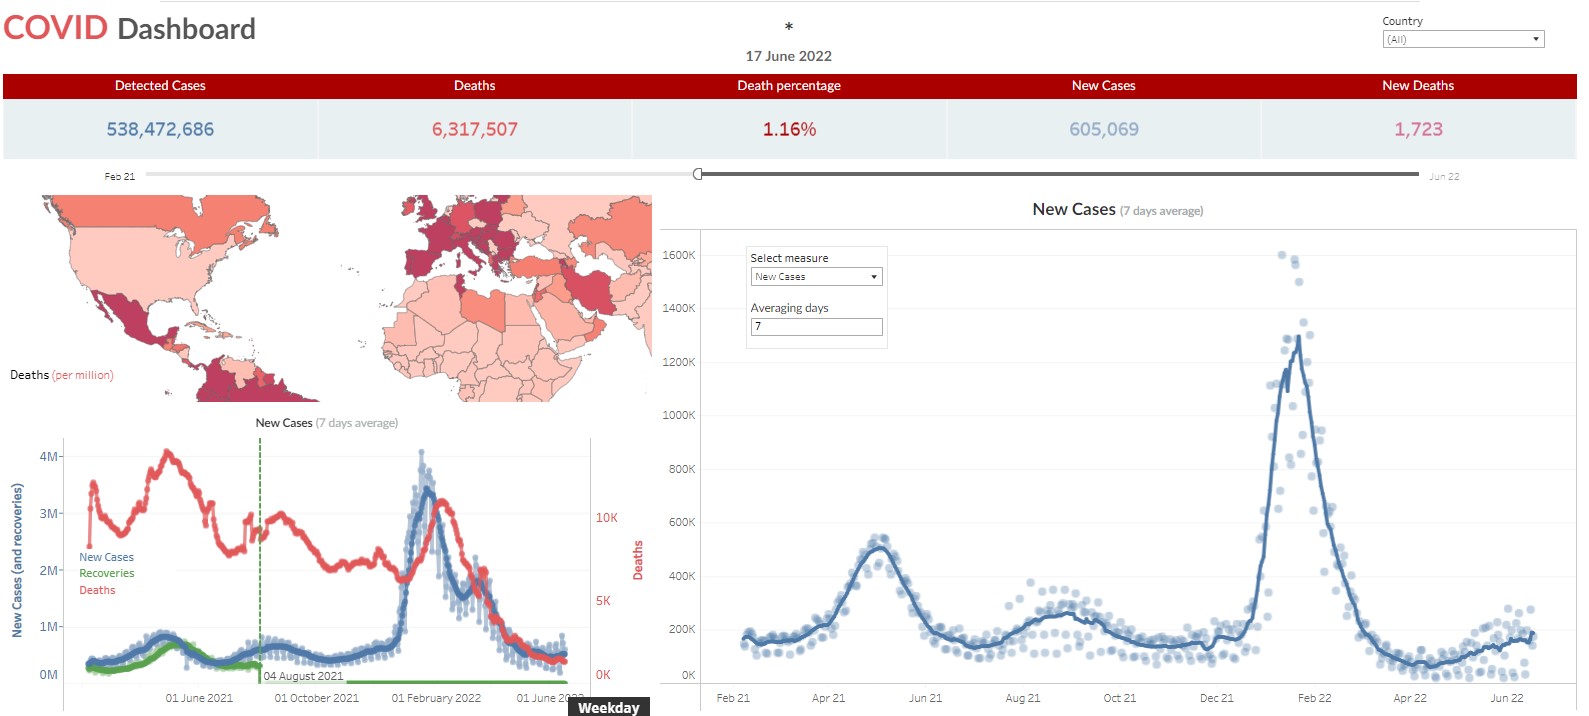
Explore the overall impact of COVID-19 statistics worldwide through this interactive Tableau dashboard based on the John Hopkins data on COVID-19. You may gain a comprehensive overview of the global situation, track virus progress by country, and uncover meaningful patterns and trends. Filter, sort, and drill down into specific regions of interest. Whether you're a researcher, policy-maker, or simply curious, this valuable resource helps you understand the global impact of COVID-19.
NB: On March 10, 2023, the Johns Hopkins Coronavirus Resource Center ceased its collecting and reporting of global COVID-19 data.
Use Dashboard