About me
I'm a Data Scientist with a passion for problem-solving and data-driven solutions that yield meaningful results. I have a background in physics, which has given me the necessary tools to carry meaningful statistical analyses and make use of machine learning algorithms to extract valuable insights from data and build models that can make a real impact. So far I've worked with a variety of tools and technologies, including Python, SQL and Tableau.
One of the things I love most about being a Data Scientist is the opportunity to collaborate with cross-functional teams to forecast the behaviour of complex systems and communicate the acquired insights to a wide range of audiences, from stakeholders to technicians
Physics
For most of my adult life I've wondered about the fundamental reasons that explain the way everything arround us behaves the way it does.
Data Science
Articles, notebooks, tips and anything related to data science that I think is worth sharing will eventually have a blog entry under the blog section.
Github
Most of the projects I'll be working on my free time will have a simplified version on my github profile.
Publications
Are “Superentropic” black holes superentropic?
Appels M., Cuspinera, L., Gregory, R. et al. High Energ. Phys. 2020, 195 (2020).
https://doi.org/10.1007/JHEP02(2020)195
Higgs vacuum decay in a braneworld
Leopoldo Cuspinera, Ruth Gregory, Katie M. Marshall, and Ian G. Moss International Journal of Modern Physics DVol. 29, No. 01, 2050005 (2020)
https://doi.org/10.1142/S0218271820500054
Higgs vacuum decay from particle collisions?
Leopoldo Cuspinera, Ruth Gregory, Katie M. Marshall, and Ian G. Moss Phys. Rev. D 99, 024046 – Published 30 January 2019
Photography
In my free time I also like to take pictures of whatever I think will trigger the nodes that will activate my fondest memories.
Here are a few of these.
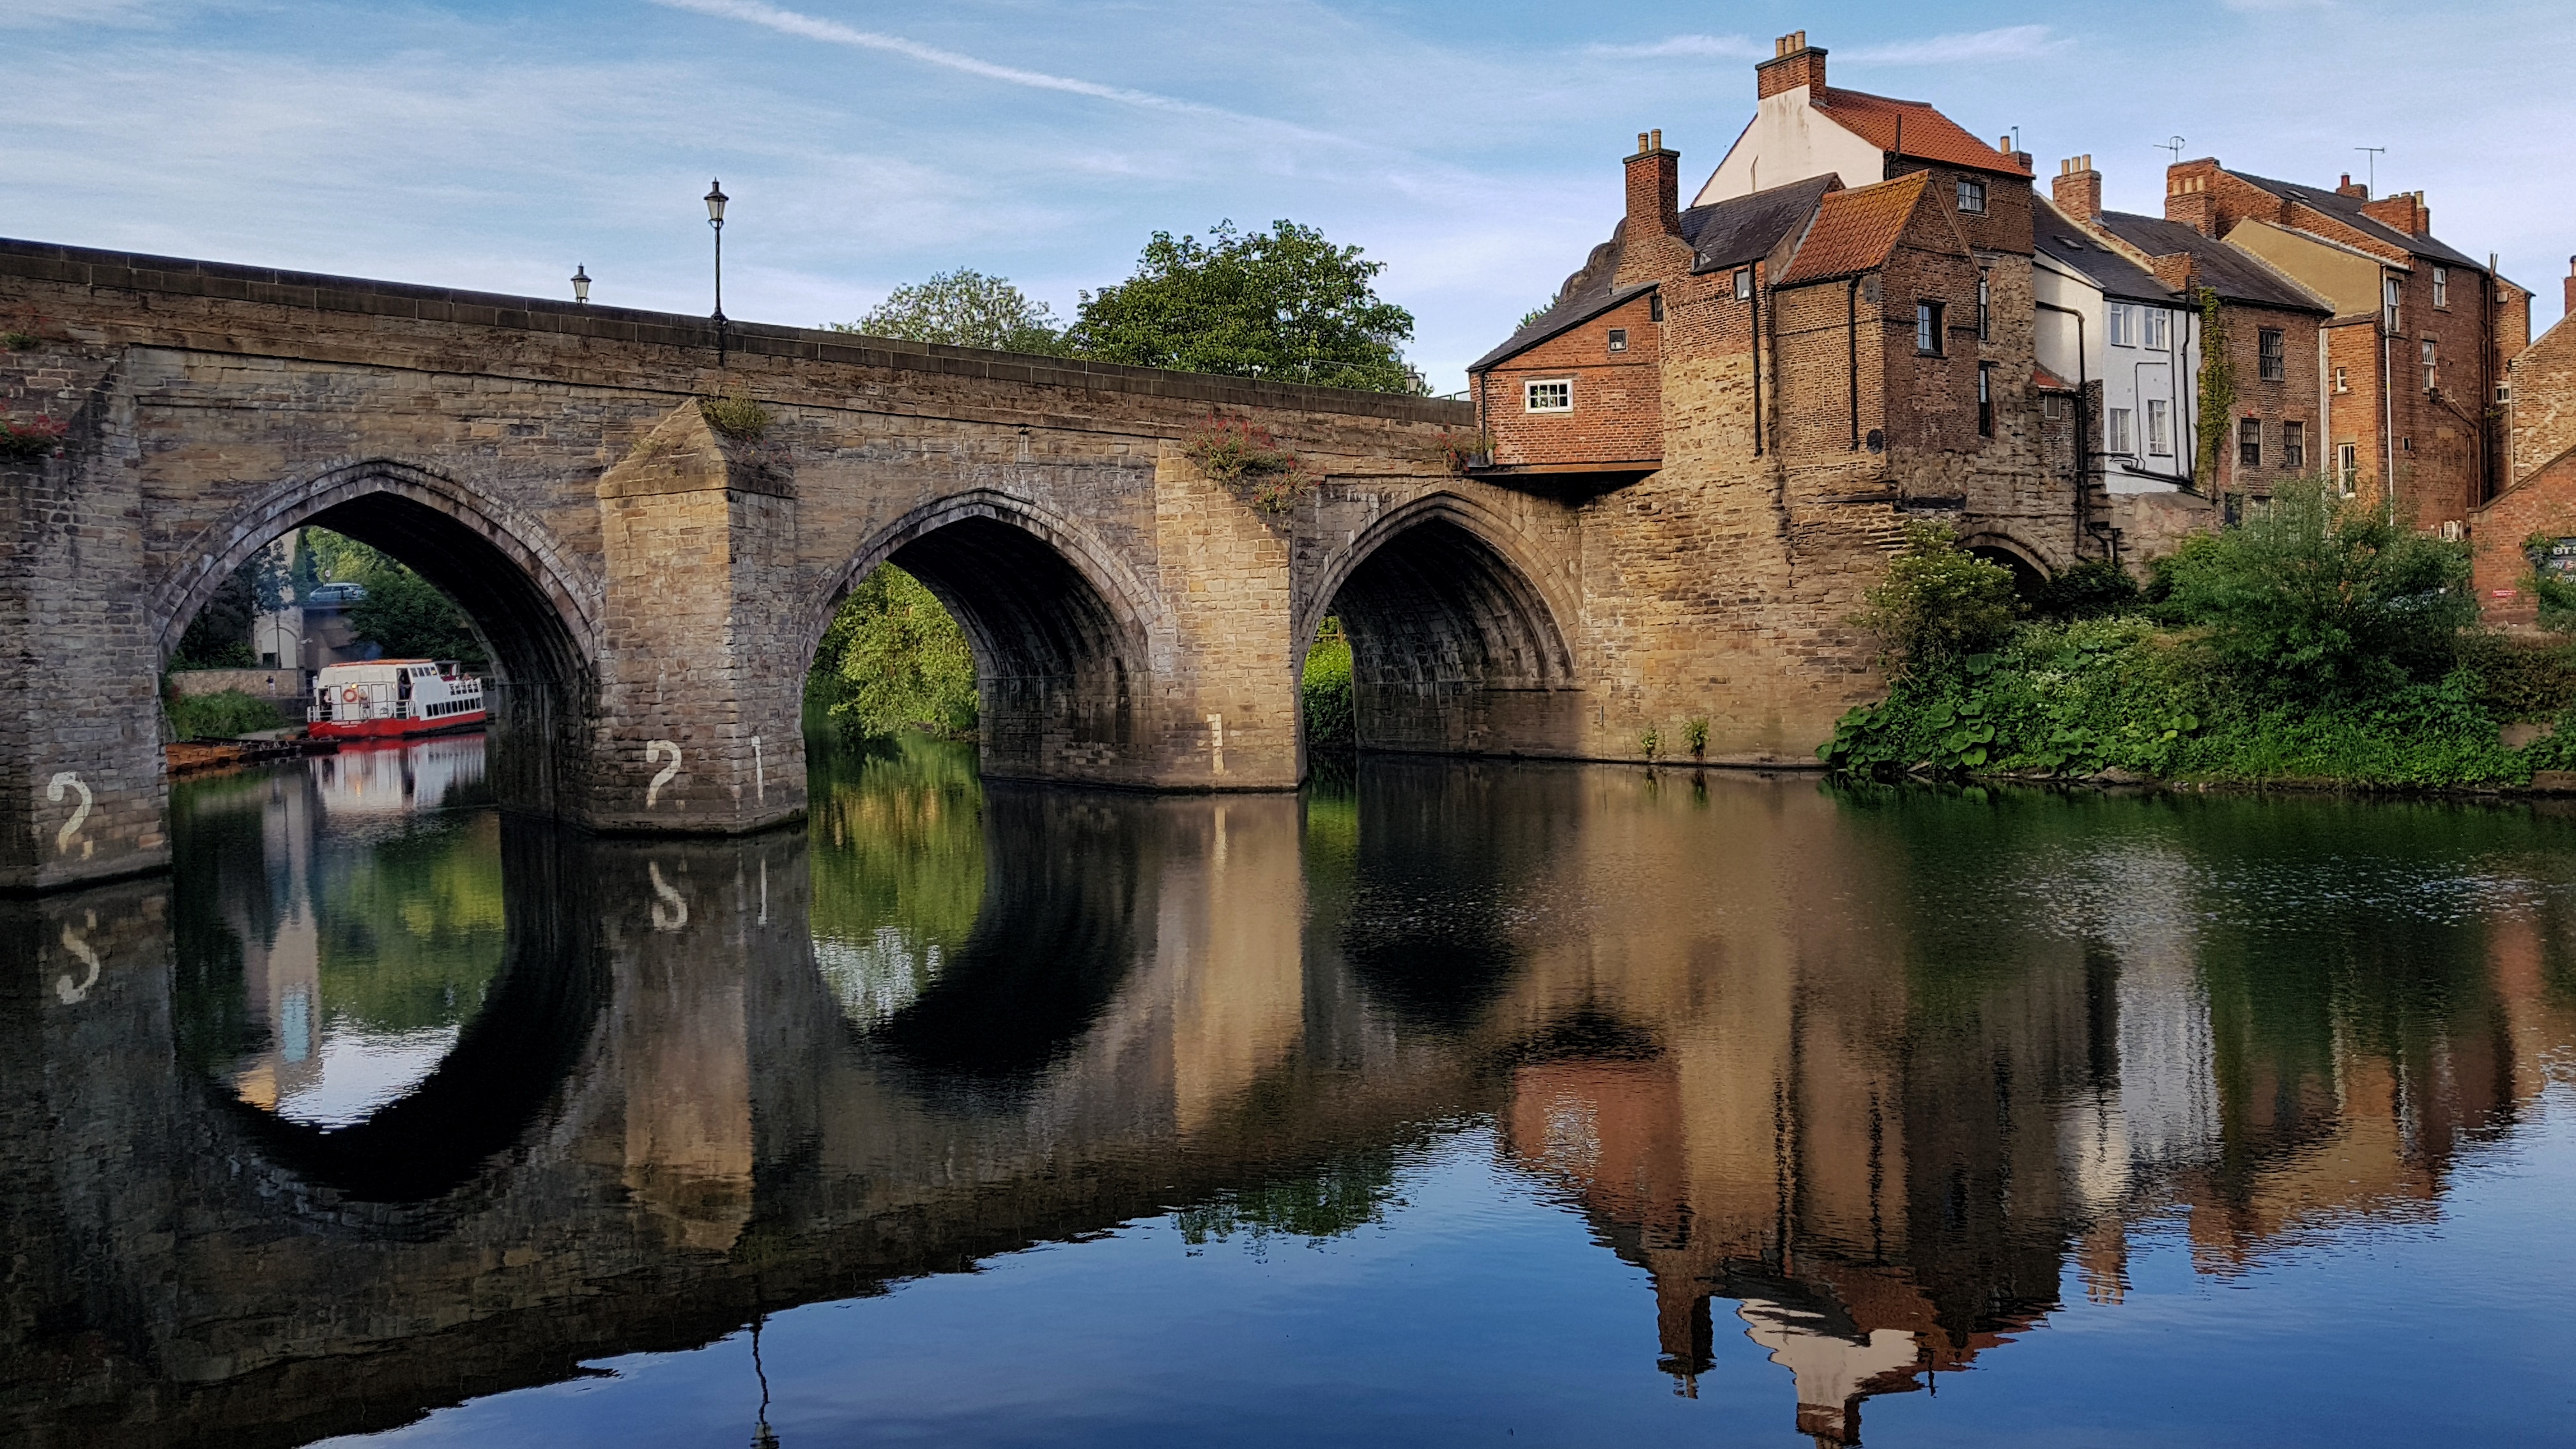
Elvet bridge, Durham

Mumbles, Swansea

Durham in spring

Tepoztlán, Mexico
Useful blog entries
These are some of my favorite blog entries but you can checkout all blog entries here.
In this blog post, I will be sharing a curated collection of practical tips and insightful notes that I have used over and over again in my career as a data scientist. These are meant to be personal references for myself but they might help others.
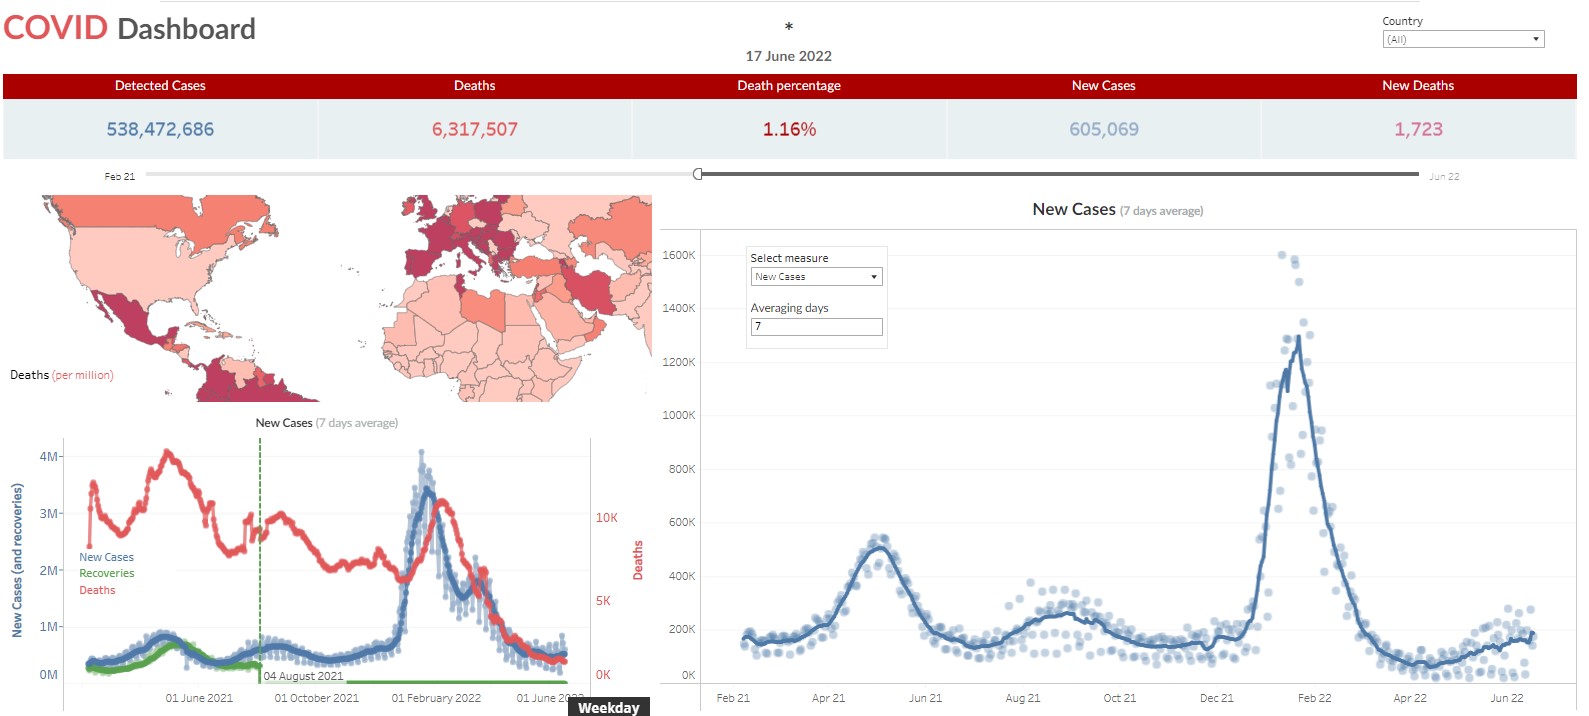
Explore the overall impact of COVID-19 statistics worldwide through this interactive Tableau dashboard based on the John Hopkins data on COVID-19. You may gain a comprehensive overview of the global situation, track virus progress by country, and uncover meaningful patterns and trends. Filter, sort, and drill down into specific regions of interest. Whether you're a researcher, policy-maker, or simply curious, this valuable resource helps you understand the global impact of COVID-19.
Explore the overall impact of COVID-19 statistics worldwide through this interactive Tableau dashboard based on the John Hopkins data on COVID-19. You may gain a comprehensive overview of the global situation, track virus progress by country, and uncover meaningful patterns and trends. Filter, sort, and drill down into specific regions of interest. Whether you're a researcher, policy-maker, or simply curious, this valuable resource helps you understand the global impact of COVID-19.
NB: On March 10, 2023, the Johns Hopkins Coronavirus Resource Center ceased its collecting and reporting of global COVID-19 data.